




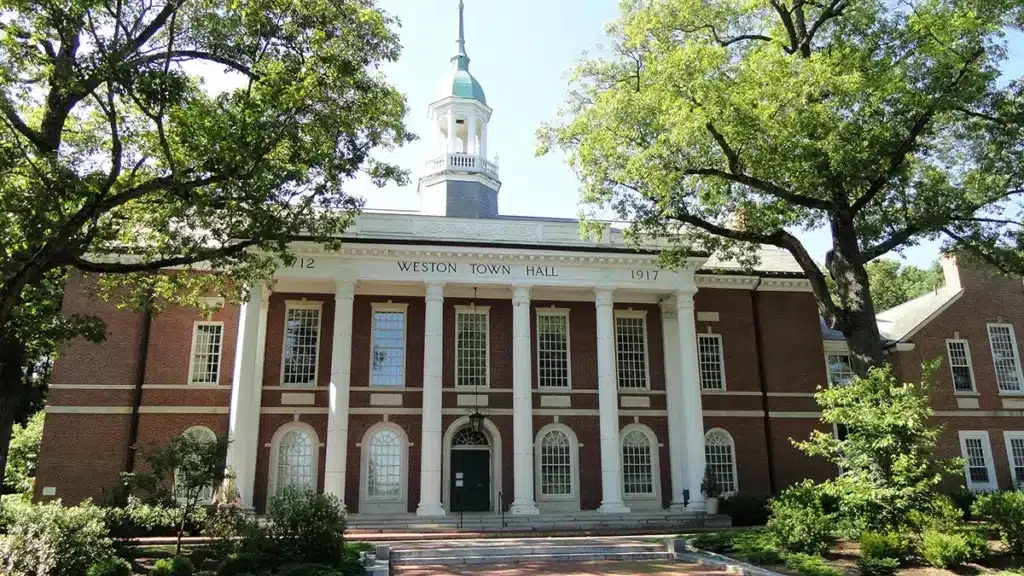
Weston, MA
FY2026 municipal average single-family property tax bill. 1View methodology and disclaimers.

makes all the difference
Team Coyle — a trusted team of Wellesley real estate agents — delivers a seamless, full-service real estate experience designed to help clients make smart, financially rewarding moves across Wellesley and Greater Boston. Recent awards include:
Work With Us Move or stay put? Read the guide →
Buying or selling a home takes experience, local knowledge, and the right strategy. Our Wellesley real estate team combines hands-on service with proven results to help clients move with confidence.
Our house sat on the market for more than a year with the previous agents. Once Ying and Matt took over, it was sold within three months.
— Brian Li
Ying and Matt helped us sell our home and purchase a new one. Their pricing strategy, clear communication, and strong network led to our $2M+ home going from listing to accepted offer in just three days.
— Dong Zeng
By Team Coyle, Wellesley Real Estate Agents at Compass
$5,497,000
48 Marshall Rd., Wellesley, MA 02482
5 Beds | 5F 2H Baths | 6,377 Sq Ft
$1,025,000
14 Millstone Dr U:14 Sherborn, MA 01770
3 Beds | 2F 1H Baths | 2,568 Sq Ft
We don’t just list your home—we launch it. From day one, we create an attention-getting, multi-channel marketing plan and pricing strategy designed to attract the maximum number of buyers and to sell your home for more.
Using real-time market data and 25+ years of local expertise, we set an intelligent price for your home that maximizes strong interest and favorable offers from ready, willing and able buyers.
Simply stated—we put your interests first. Since 2015, we have successfully negotiated 150+ deals in the Wellesley real estate and Greater Boston markets, but don’t take our word for it—read what our clients have to say.
Includes a complimentary professional home valuation.
TownRatings™1
Discover how Team Coyle’s TownRatings™ model compares select Greater Boston communities across academic performance, commute, shopping and dining, lifestyle, and property tax.
*FY2026 municipal average single-family property tax bill. 1View methodology and disclaimers.

TownRatings™ is a proprietary rating model developed by Team Coyle to help buyers and sellers make informed decisions about Greater Boston real estate. The model analyzes five key community characteristics across a dataset of 64 Greater Boston municipalities using publicly available data and Team Coyle’s local market insights where applicable. The resulting ratings represent Team Coyle’s informed opinions and are intended as comparative guides, not guarantees or recommendations.
Important Disclosure: This analysis serves as a general, supplemental guide for consumers. The report cards featured on this page represent a curated selection of our dataset, and Team Coyle retains sole discretion over the publication and availability of individual municipal ratings. Users must independently verify all data critical to a real estate transaction and consult qualified professionals when appropriate. Ratings are current as of August 26, 2026.
Academic Performance and Property Tax are ranked relative to the other municipalities within the TownRatings™ dataset. Commute to Boston and Shopping & Dining use fixed rating scales. Lifestyle is a non-ranked, descriptive classification.
Evaluates Grade 10 MCAS academic achievement in English Language Arts and Mathematics, together with Grade 10 student growth, using 2025 public school district data reported by the Massachusetts Department of Elementary and Secondary Education (DESE). Ratings reflect each district’s relative position within the TownRatings™ dataset.
| Rating Tier | Relative Position in Dataset |
|---|---|
| Top Tier | 90th percentile and above |
| Upper Tier | 70th to under 90th percentile |
| Middle Tier | 30th to under 70th percentile |
| Lower Tier | 10th to under 30th percentile |
| Bottom Tier | Below the 10th percentile |
Ratings compare Grade 10 public school district results only within the TownRatings™ dataset. They are not statewide classifications of overall school quality and do not evaluate private schools, individual public schools, other grade levels, programs, or individual student outcomes.
Measures standardized weekday morning drive time from each municipality to a fixed destination in Boston and in-town MBTA transit availability, defined as a commuter-rail or rapid-transit option. A transit-option credit is factored into the Adjusted Commute Score to reflect the availability of an in-town alternative to driving. The transit component measures availability, not actual train travel time.
| Rating Scale | Adjusted Commute Score (minutes) |
|---|---|
| Easy | ≤ 35 |
| Manageable | > 35 to ≤ 55 |
| Typical | > 55 to < 70 |
| Challenging | ≥ 70 to < 80 |
| Difficult | ≥ 80 |
The Adjusted Commute Score is a standardized, transit-adjusted figure expressed in minutes for comparison across municipalities. Municipalities with qualifying in-town transit receive a credit and may score below their actual drive time; the score is not a door-to-door travel estimate.
Uses a structured 10-point rubric evaluating dining depth and variety, shopping depth and variety, and the strength of the municipality’s commercial centers. Evaluations draw on publicly available information and Team Coyle’s local market insights.
Only establishments physically located within the municipality and generally available to the public are counted. Options located in neighboring municipalities are not included.
| Rating Scale | Shopping & Dining Score |
|---|---|
| Extensive | 9–10 |
| Strong | 7–8 |
| Moderate | 5–6 |
| Limited | 3–4 |
| Minimal | 0–2 |
Ratings use fixed score ranges and are not determined by percentiles or a predetermined distribution of municipalities. This category measures in-town commercial offerings, not access to shopping and dining in surrounding communities.
Provides each municipality with a non-ranked, descriptive classification based on its predominant development pattern and physical environment. The primary classifications—Urban, Suburban, and Rural—consider land use, development density, zoning patterns, and the built environment.
A Historic modifier may be added where documented historic resources materially contribute to the municipality’s character, based on sources such as MACRIS, local historical commissions, and municipal records.
Scale Urban · Suburban · Rural
Modifiers Historic
Compares each municipality’s FY2026 average single-family property tax bill using the Average Single-Family Tax Bill report issued by the Massachusetts Department of Revenue, Division of Local Services. The published amount is a municipality-level average and is not an estimate of the tax bill for any particular property.
| Rating Scale | Relative Position by Tax Bill |
|---|---|
| Very Low | Below the 2.5th percentile |
| Low | 2.5th to under the 25th percentile |
| Average | 25th to under the 75th percentile |
| High | 75th to under the 97.5th percentile |
| Very High | 97.5th percentile and above |
Ratings rank the published average bills from lowest to highest within the TownRatings™ dataset. The classifications are relative and do not represent permanent dollar ranges. Because the average bill reflects both assessed values and the residential tax rate, a High or Very High classification indicates a relatively high average bill—not necessarily a high tax rate.
Use of TownRatings™ and this website is also subject to Team Coyle’s Terms of Use.