Neoclassical Architecture
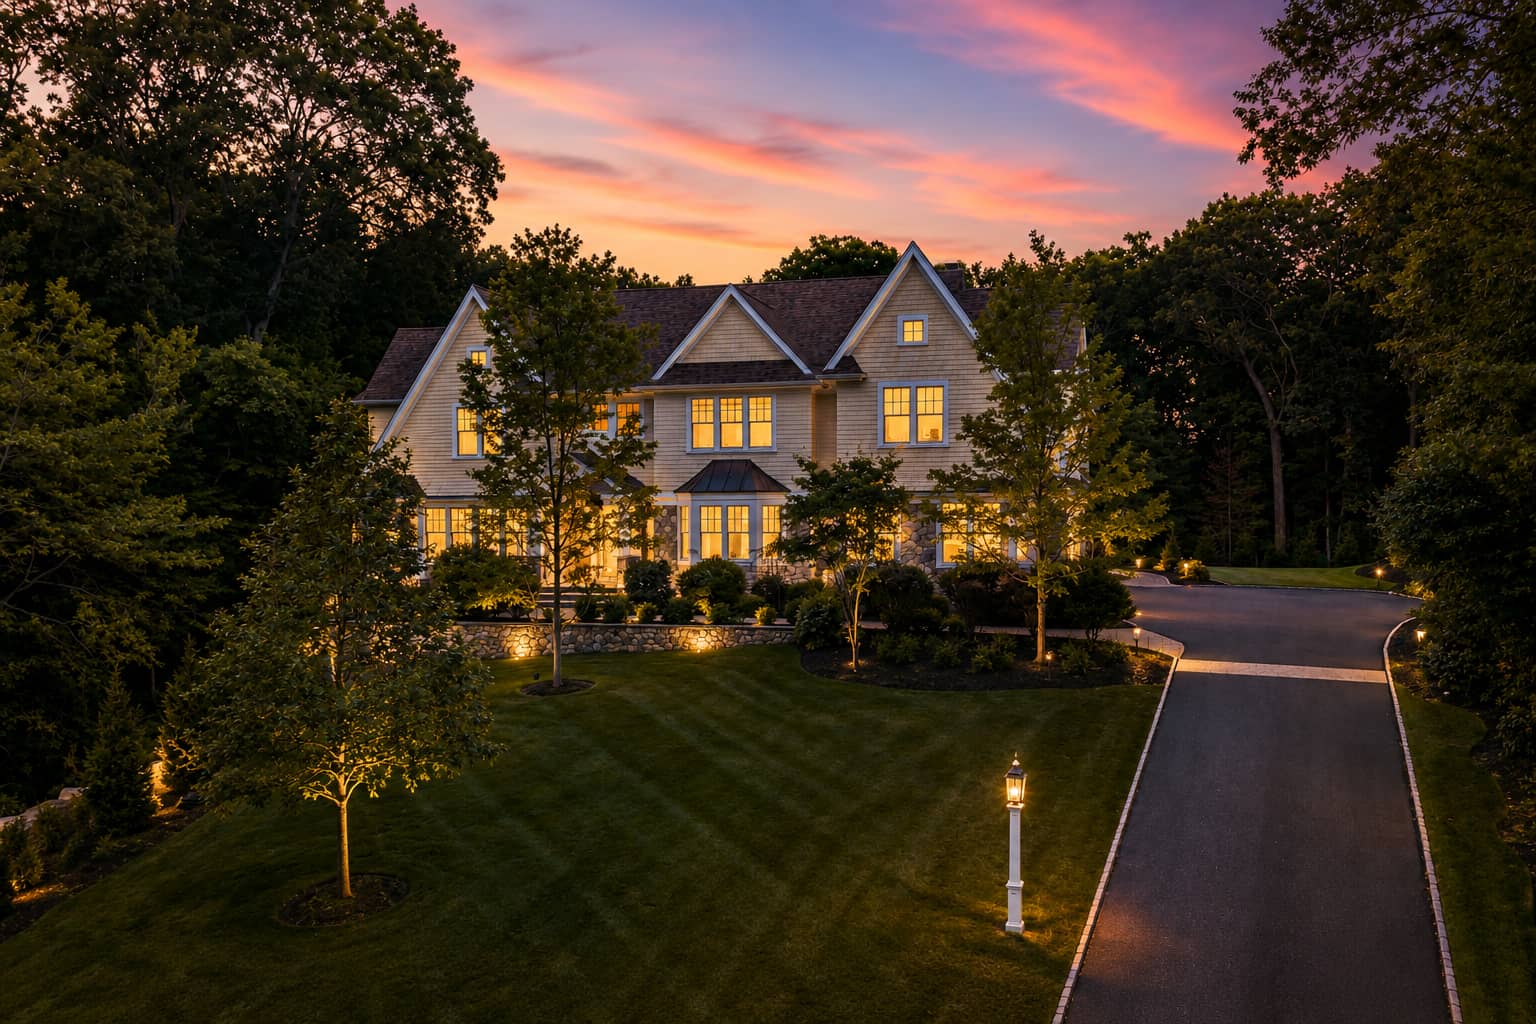
Classic Colonial symmetry meets modern Neoclassical design in this sophisticated 2017 custom build.
Listed by Team Coyle at Compass
There are homes built for the market, and then there is 48 Marshall Road. This 2017 custom Neoclassical Colonial home offers over 6,300 square feet of living space. It features five en-suite bedrooms and a level of finish rarely found in today's market. Designed for both everyday comfort and refined entertaining, the home combines elegant architectural detail and modern systems across four finished levels.
The main level is anchored by a gracious foyer and grain-matched white oak hardwood floors. The kitchen features soapstone countertops, dual dishwashers, and a walk-in pantry, while a four-floor private elevator adds convenience and long-term flexibility. Upstairs, the five en-suite bedrooms offer total privacy. Further, a flexible third level provides the perfect footprint for an office, play area, or weekend sleepovers.
The finished lower level is a standout, with 9+ foot ceilings, an executive office, and a home gym. It also includes bespoke wine storage and a Bowers & Wilkins 800 Series Diamond theater designed for a true cinematic experience.
Outside, the property continues to impress with mature landscaping and arborvitae privacy screening. The grounds feature a private patio, outdoor fireplace, hot tub, and two EV chargers. Located in The Generals micro-neighborhood, within the broader Wellesley Fells and Woodlands area, this home offers easy access to Morses Pond and the newly built Hardy Elementary School.
Classic Colonial symmetry meets modern Neoclassical design in this sophisticated 2017 custom build.
Professional-grade culinary space featuring dual dishwashers, soapstone counters, and a full walk-in pantry.
A spacious, sun-filled room that connects seamlessly to the kitchen, perfect for everyday gatherings, cooking, or relaxing.
A sun-filled private and spacious refuge with generous closet space connected to a spa-like tiled bath.
Grounds professionally regraded for drainage and full arborvitae screening for a dry, private, and level outdoor oasis.
Relax and enjoy the outdoors with your own private hot tub, gas fireplace, patio lounge, and barbecue area.
Get ready for a world-class, immersive cinema experience with the 800 Series Diamond audio system.
Dedicated wine and bar area perfectly situated between work and play.
A sophisticated quiet workspace featuring custom built-ins and detailed millwork, designed for productivity.
A spacious wellness retreat with 9+ foot ceilings and ample room for a full suite of professional-grade exercise equipment.
*Some images may have been digitally enhanced for clarity and presentation purposes.
Detailed insights regarding the property features of 48 Marshall Road, neighborhood life in The Generals, and the broader Wellesley community.
48 Marshall Road is located in the micro-neighborhood known as “The Generals,” within the broader Wellesley Fells and Woodlands area on the north side of Wellesley.
The appeal is the balance of privacy and proximity. The home offers a quieter residential feel while remaining close to Morses Pond, Linden Square, and the newly built Hardy Elementary School.
In 2026, residents are assigned to Hardy Elementary School. Students typically continue to Wellesley Middle School and Wellesley High School.
The property is right next to Morses Pond for swimming and boating. Other options include Boulder Brook Reservation and Rocky Ledges for hiking and trails.
Yes, it is convenient to Wellesley Country Club and Nehoiden Golf Club.
Quick access to Route 9, I-95, and the Mass Pike. For rail, the Wellesley Square Station is the primary MBTA option.
TownRatings™ is a proprietary rating model developed by Team Coyle to help buyers and sellers make informed decisions about Greater Boston real estate. The model analyzes five key community characteristics across a dataset of 64 Greater Boston municipalities using publicly available data and Team Coyle’s local market insights where applicable. The resulting ratings and classifications represent Team Coyle’s informed opinions and are intended as general informational guides, not guarantees or recommendations.
Important Disclosure: This analysis serves as a general, supplemental guide for consumers. The report cards featured on this page represent a curated selection of our dataset, and Team Coyle retains sole discretion over the publication and availability of individual municipal ratings. Users must independently verify all data critical to a real estate transaction and consult qualified professionals when appropriate. Ratings are current as of August 30, 2026.
Academic Performance and Property Tax are ranked relative to the other municipalities within the TownRatings™ dataset. Commute to Boston and Shopping & Dining use fixed rating scales. Lifestyle is a non-ranked, descriptive classification.
Evaluates Grade 10 MCAS academic achievement in English Language Arts and Mathematics, together with Grade 10 student growth, using 2025 public school district data reported by the Massachusetts Department of Elementary and Secondary Education (DESE). Ratings reflect each district’s relative position within the TownRatings™ dataset.
| Rating Tier | Relative Position in Dataset |
|---|---|
| Top Tier | 90th percentile and above |
| Upper Tier | 70th to under 90th percentile |
| Middle Tier | 30th to under 70th percentile |
| Lower Tier | 10th to under 30th percentile |
| Bottom Tier | Below the 10th percentile |
Ratings compare Grade 10 public school district results only within the TownRatings™ dataset. They are not statewide classifications of overall school quality and do not evaluate private schools, individual public schools, other grade levels, programs, or individual student outcomes.
Measures standardized weekday morning drive time from each municipality to a fixed destination in Boston and in-town MBTA transit availability, defined as a commuter-rail or rapid-transit option. A transit-option credit is factored into the Adjusted Commute Score to reflect the availability of an in-town alternative to driving. The transit component measures availability, not actual train travel time.
| Rating Scale | Adjusted Commute Score (minutes) |
|---|---|
| Easy | ≤ 35 |
| Manageable | > 35 to ≤ 55 |
| Typical | > 55 to < 70 |
| Challenging | ≥ 70 to < 80 |
| Difficult | ≥ 80 |
The Adjusted Commute Score is a standardized, transit-adjusted figure expressed in minutes for comparison across municipalities. Municipalities with qualifying in-town transit receive a credit and may score below their actual drive time; the score is not a door-to-door travel estimate.
Uses a structured 10-point rubric evaluating dining depth and variety, shopping depth and variety, and the strength of the municipality’s commercial centers. Evaluations draw on publicly available information and Team Coyle’s local market insights.
Only establishments physically located within the municipality and generally available to the public are counted. Options located in neighboring municipalities are not included.
| Rating Scale | Shopping & Dining Score |
|---|---|
| Extensive | 9–10 |
| Strong | 7–8 |
| Moderate | 5–6 |
| Limited | 3–4 |
| Minimal | 0–2 |
Ratings use fixed score ranges and are not determined by percentiles or a predetermined distribution of municipalities. This category measures in-town commercial offerings, not access to shopping and dining in surrounding communities.
Provides each municipality with a non-ranked, descriptive classification based on its predominant development pattern and physical environment. The primary classifications—Urban, Suburban, and Rural—consider land use, development density, zoning patterns, and the built environment.
A Historic modifier may be added where documented historic resources materially contribute to the municipality’s character, based on sources such as MACRIS, local historical commissions, and municipal records.
Scale Urban · Suburban · Rural
Modifier Historic
These classifications describe characteristics of the municipality, not its residents, overall desirability, or suitability for any particular buyer.
Compares each municipality’s FY2026 average single-family property tax bill using the Average Single-Family Tax Bill report issued by the Massachusetts Department of Revenue, Division of Local Services. The published amount is a municipality-level average and is not an estimate of the tax bill for any particular property.
| Rating Scale | Relative Position by Tax Bill |
|---|---|
| Very Low | Below the 2.5th percentile |
| Low | 2.5th to under the 25th percentile |
| Average | 25th to under the 75th percentile |
| High | 75th to under the 97.5th percentile |
| Very High | 97.5th percentile and above |
Ratings rank the published average bills from lowest to highest within the TownRatings™ dataset. The classifications are relative and do not represent permanent dollar ranges. Because the average bill reflects both assessed values and the residential tax rate, a High or Very High classification indicates a relatively high average bill—not necessarily a high tax rate.
Use of TownRatings™ and this website is also subject to Team Coyle’s Terms of Use.