3 Reasons To Buy a Home This Summer

Real Estate News

3 Reasons To Buy a Home This Summer

Vibrant sunflower backlit by the warm glow of a sunset, capturing summer essence.

Are you thinking about buying a home, but not sure if now’s the right time? A lot of people are waiting and wondering what the market’s going to do next. But here’s something only the savviest buyers realize:

This summer might actually be the best time to buy in years. Here are three big reasons why.

1. You Have More Negotiating Power

After several years of sellers having all the leverage, things are starting to shift. Check out the graph below. It uses data from Redfin to show that right now, there are more sellers active in the market than buyers:

Graph showing decline in active buyers and sellers from 2015 to 2023.

Take a look at what happened back in 2021 through roughly 2023. In that time period, there were far more buyers (the blue line) looking to buy than homes for sale (the green line). That’s what drove the intense competition, bidding wars, and the exponential price growth the market saw back then.

Now, the market has shifted, and buyers are regaining their negotiating power as a result. With more sellers than buyers, sellers may be more willing to pay for repairs, cover some of your closing costs, or lower their asking price. The return of this kind of normal balance is a sign of a much healthier, more sustainable market. As Lawrence Yun, Chief Economist of the National Association of Realtors (NAR), explains:

“ . . . with housing inventory levels reaching five-year highs, homebuyers in nearly every region of the country are in a better position to negotiate more favorable terms.”

And just in case you’re worried there are too many homes on the market, here’s what you should know. Overall inventory is still lower than normal, so you don’t have to worry about a nationwide oversupply or a crash.

2. You Have More Choices

The number of homes for sale has improved a lot. Based on the latest data from Realtor.com, more homes were listed this May than in May 2024 or May 2023 (see graph below):
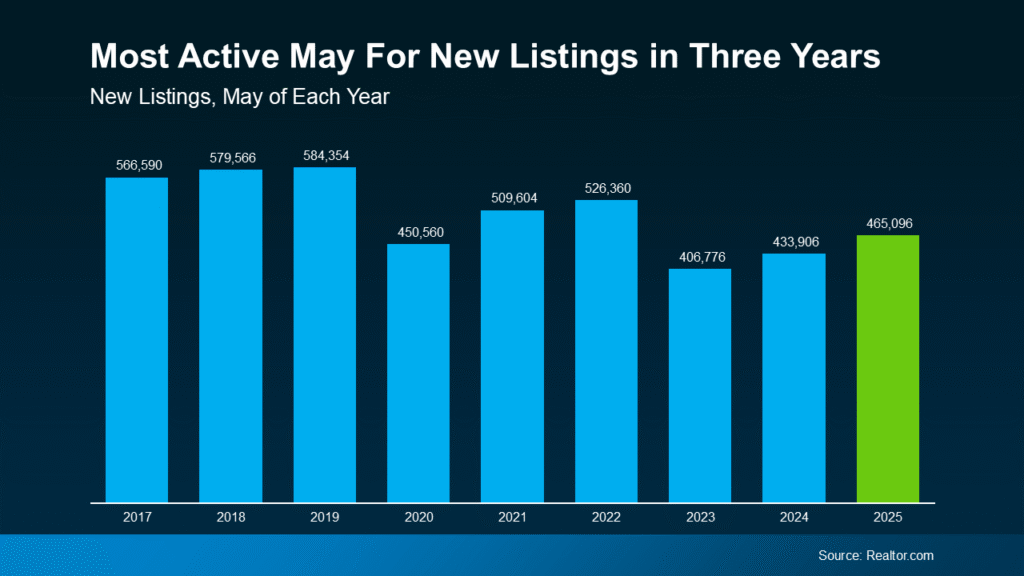
Bar chart showing active May listings from 2014 to 2023.

And more homes for sale means more choices. There’s a good chance your perfect match just hit the market – or it will soon. So, it’s a great time to explore what’s out there. As Jake Krimmel, Economist at Realtor.com, says:

“With more fresh inventory hitting the market, buyers have better opportunities to find a home that fits their needs.”

3. You May See More Flexibility on Price

With more homes for sale, they’re not selling at the same frenzied pace they were just a few years ago.

Since homes are taking more time to sell, some sellers are choosing to lower their asking prices to draw buyers back in or speed up the process. And that’s to-be-expected. According to Realtor.com19.1% of listings had a price cut this May (see graph below):
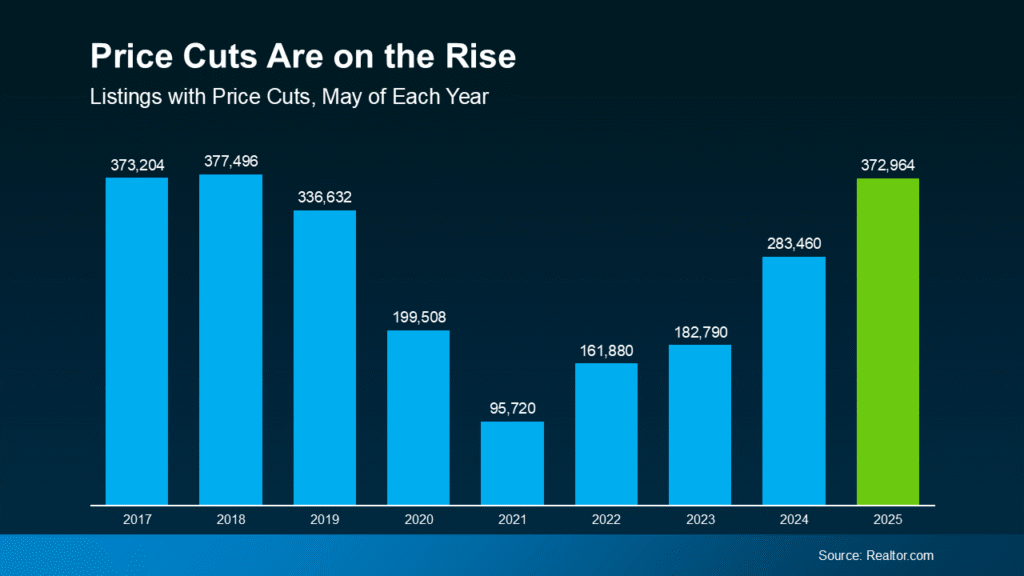
Bar chart showing rising corporate layoffs from 2018 to 2023.

That’s the fifth straight month where more sellers have reduced their price. And, as of May, the volume of price cuts is back at normal levels. This is yet another sign of the return to a more balanced market.

While you shouldn’t expect a big discount, you may find sellers are a bit more flexible right now. As a recent article from The Street says:

Although sellers have had the upper hand in the housing market over the past few years, houses are now staying on the market for longer, shifting negotiating power back to homebuyers.”

Just remember, most sellers still aren’t adjusting their prices – just the ones who overpriced to start with. So, this isn’t a sign of a crash, it’s a sign of some sellers having outdated expectations in a shifting market.

Bottom line

This summer brings a powerful combo for buyers: more homes to choose from, less competition, and sellers being more flexible on pricing. If you’re ready to make a move, let’s connect.


Matt and Ying Coyle of Team Coyle
Matt & Ying Coyle, REALTORS®

The Right Home Starts With the Right Community.

Find the community that fits your lifestyle. Get firsthand insight into neighborhoods, commutes, town amenities, and available homes.

Before the Perfect Home… Find the Perfect Community

Team Coyle has been helping homebuyers and sellers find their perfect home in the perfect community since 2015. Explore our local real estate and community guides below.

Curated Listings

By Team Coyle at Compass

$5,497,000

48 Marshall Road

48 Marshall Rd., Wellesley, MA 02482

5 Beds | 5F 2H Baths | 6,377 Sq Ft

How we get you more

Disclaimer: The information, opinions, estimates, and commentary in this article are provided for general informational and educational purposes only and should not be relied upon as legal, tax, accounting, appraisal, investment, mortgage, financing, zoning, permitting, construction, title, insurance, or other professional advice. Real estate information, market conditions, pricing, measurements, square footage, taxes, zoning, school information, and property details may change without notice and may be incomplete, approximate, or derived from third-party sources. You are solely responsible for independently verifying all facts and for consulting the appropriate licensed or qualified professionals before making any decision or taking any action. Team Coyle does not guarantee the accuracy or completeness of the information provided and is not liable for any loss, damage, cost, or consequence arising from reliance on this content. Your use of this content is also subject to our Terms of Use.

Scroll to Top

Let's Plan your next big move

联系我们 Contact Us

Ying Coyle, REALTOR®

Methodology

TownRatings™ is a proprietary rating model developed by Team Coyle to help buyers and sellers make informed decisions about Greater Boston real estate. The model analyzes five key community characteristics across a dataset of 64 Greater Boston municipalities using publicly available data and Team Coyle’s local market insights where applicable. The resulting ratings and classifications represent Team Coyle’s informed opinions and are intended as general informational guides, not guarantees or recommendations.

Important Disclosure: This analysis serves as a general, supplemental guide for consumers. The report cards featured on this page represent a curated selection of our dataset, and Team Coyle retains sole discretion over the publication and availability of individual municipal ratings. Users must independently verify all data critical to a real estate transaction and consult qualified professionals when appropriate. Ratings are current as of August 30, 2026.

Rating Categories

Academic Performance and Property Tax are ranked relative to the other municipalities within the TownRatings™ dataset. Commute to Boston and Shopping & Dining use fixed rating scales. Lifestyle is a non-ranked, descriptive classification.

  • Academic Performance

    Evaluates Grade 10 MCAS academic achievement in English Language Arts and Mathematics, together with Grade 10 student growth, using 2025 public school district data reported by the Massachusetts Department of Elementary and Secondary Education (DESE). Ratings reflect each district’s relative position within the TownRatings™ dataset.

    Rating Tier Relative Position in Dataset
    Top Tier 90th percentile and above
    Upper Tier 70th to under 90th percentile
    Middle Tier 30th to under 70th percentile
    Lower Tier 10th to under 30th percentile
    Bottom Tier Below the 10th percentile

    Ratings compare Grade 10 public school district results only within the TownRatings™ dataset. They are not statewide classifications of overall school quality and do not evaluate private schools, individual public schools, other grade levels, programs, or individual student outcomes.

  • Commute to Boston

    Measures standardized weekday morning drive time from each municipality to a fixed destination in Boston and in-town MBTA transit availability, defined as a commuter-rail or rapid-transit option. A transit-option credit is factored into the Adjusted Commute Score to reflect the availability of an in-town alternative to driving. The transit component measures availability, not actual train travel time.

    Rating Scale Adjusted Commute Score (minutes)
    Easy ≤ 35
    Manageable > 35 to ≤ 55
    Typical > 55 to < 70
    Challenging ≥ 70 to < 80
    Difficult ≥ 80

    The Adjusted Commute Score is a standardized, transit-adjusted figure expressed in minutes for comparison across municipalities. Municipalities with qualifying in-town transit receive a credit and may score below their actual drive time; the score is not a door-to-door travel estimate.

  • Shopping & Dining

    Uses a structured 10-point rubric evaluating dining depth and variety, shopping depth and variety, and the strength of the municipality’s commercial centers. Evaluations draw on publicly available information and Team Coyle’s local market insights.


    Only establishments physically located within the municipality and generally available to the public are counted. Options located in neighboring municipalities are not included.

    Rating Scale Shopping & Dining Score
    Extensive 9–10
    Strong 7–8
    Moderate 5–6
    Limited 3–4
    Minimal 0–2

    Ratings use fixed score ranges and are not determined by percentiles or a predetermined distribution of municipalities. This category measures in-town commercial offerings, not access to shopping and dining in surrounding communities.

  • Lifestyle

    Provides each municipality with a non-ranked, descriptive classification based on its predominant development pattern and physical environment. The primary classifications—Urban, Suburban, and Rural—consider land use, development density, zoning patterns, and the built environment.

    A Historic modifier may be added where documented historic resources materially contribute to the municipality’s character, based on sources such as MACRIS, local historical commissions, and municipal records.

    Scale Urban · Suburban · Rural

    Modifier Historic

    These classifications describe characteristics of the municipality, not its residents, overall desirability, or suitability for any particular buyer.

  • Property Tax

    Compares each municipality’s FY2026 average single-family property tax bill using the Average Single-Family Tax Bill report issued by the Massachusetts Department of Revenue, Division of Local Services. The published amount is a municipality-level average and is not an estimate of the tax bill for any particular property.

    Rating Scale Relative Position by Tax Bill
    Very Low Below the 2.5th percentile
    Low 2.5th to under the 25th percentile
    Average 25th to under the 75th percentile
    High 75th to under the 97.5th percentile
    Very High 97.5th percentile and above

    Ratings rank the published average bills from lowest to highest within the TownRatings™ dataset. The classifications are relative and do not represent permanent dollar ranges. Because the average bill reflects both assessed values and the residential tax rate, a High or Very High classification indicates a relatively high average bill—not necessarily a high tax rate.

Limitations & Disclaimers

  • Informational only: TownRatings™ is provided for general informational and educational purposes only and is subject to change without notice.
  • Category-specific: A favorable or unfavorable result in one category should not be interpreted as a judgment about a community’s overall quality, desirability, or suitability.
  • No duty to update: Team Coyle and its agents have no obligation to update, revise, or refresh any rating, commentary, methodology, or supporting information.
  • No warranties: To the fullest extent permitted by law, TownRatings™ and related information are provided on an “as is” and “as available” basis, without warranties of any kind. Team Coyle, its agents, and Compass make no representations or warranties as to accuracy, completeness, timeliness, reliability, or current availability.
  • No liability: To the fullest extent permitted by law, Team Coyle, its agents, and Compass shall not be liable for losses, damages, or costs arising from use of or reliance on TownRatings™ or related commentary.
  • Not advice: TownRatings™ and related commentary should not be relied upon as legal, tax, financial, investment, educational, transportation, appraisal, or other professional advice. Consult the appropriate licensed or qualified professionals before making a decision or taking action.
  • Verify independently: Commute times vary by route, timing, traffic, construction, weather, and MBTA conditions—check current schedules and test commutes personally. School performance, assignments, programs, and district information may change—confirm directly with school districts and DESE. Restaurants, retailers, commercial districts, property-tax figures, and other community characteristics can also change and should be independently verified.
  • Qualitative judgment: Certain TownRatings™ categories involve structured qualitative judgment. Reasonable people may weigh the same characteristics differently or reach different conclusions.
  • Third-party content: Third-party data, tools, and source material are not controlled or endorsed by Team Coyle, and their accuracy is not guaranteed. Trademarks remain the property of their respective owners.
  • Broker disclosure: Team Coyle is a team of real estate agents affiliated with Compass. Compass Massachusetts, LLC d/b/a Compass is a licensed real estate broker and abides by equal housing opportunity laws.
  • Fair housing: Nothing in TownRatings™ should be used to encourage or discourage housing decisions based on race, color, religion, sex, disability, familial status, national origin, or any other characteristic protected by applicable federal, state, or local law.

Use of TownRatings™ and this website is also subject to Team Coyle’s Terms of Use.