Cliff Estates vs. Wellesley Farms: Presence or Privacy?

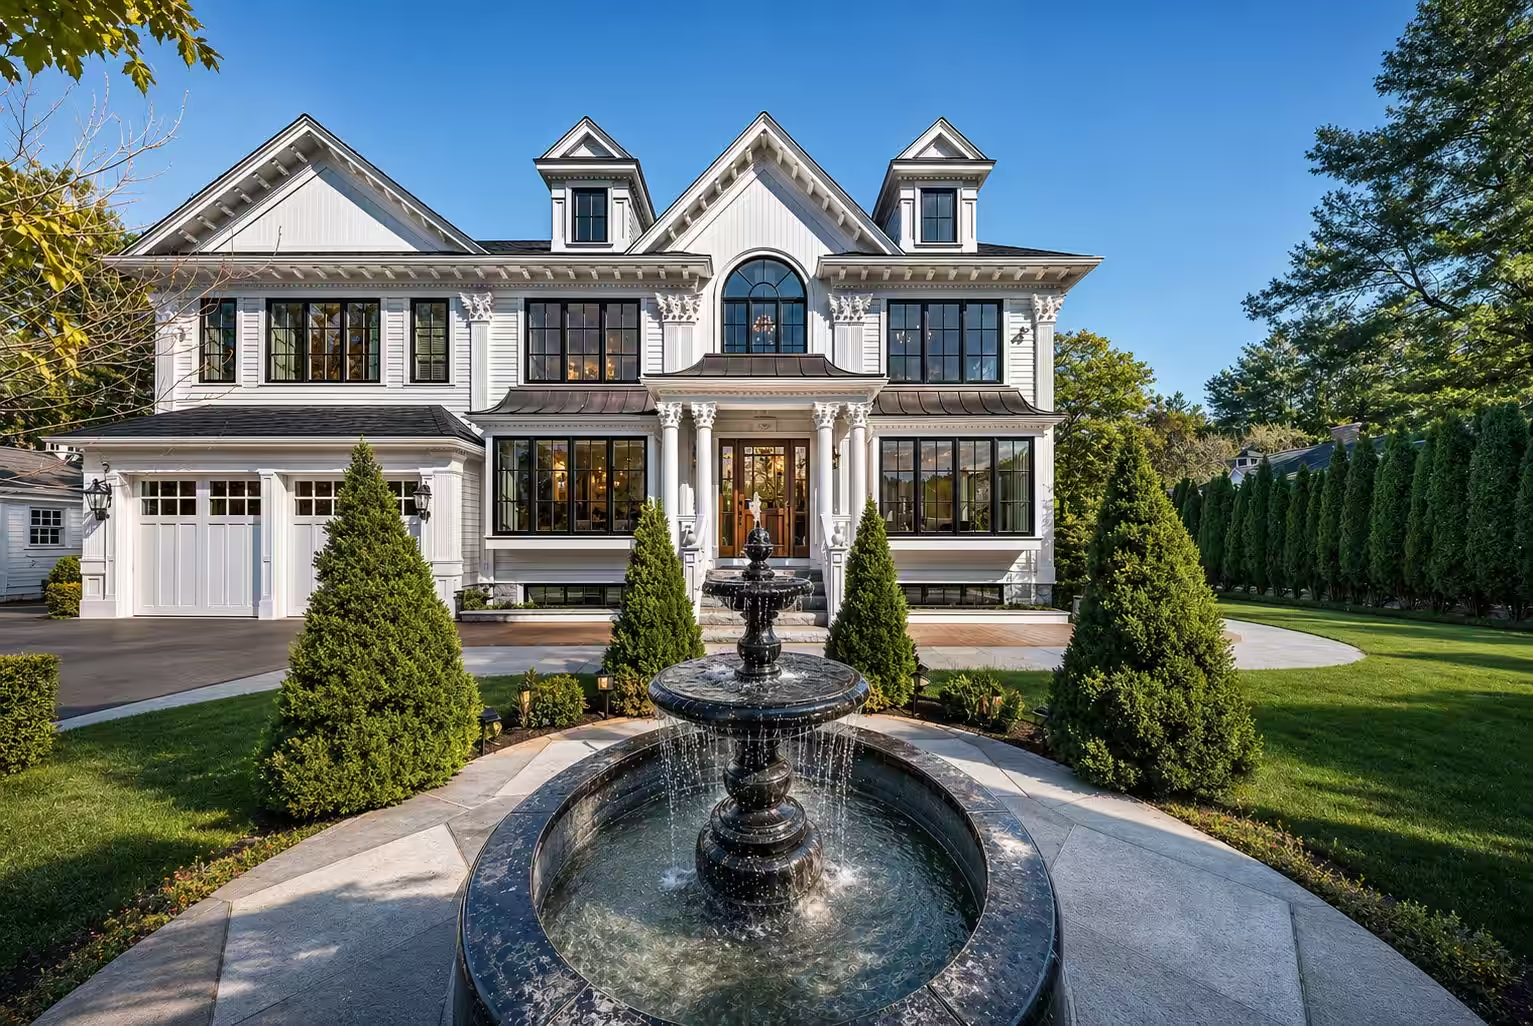
Cliff Estates vs Wellesley Farms Wellesley MA comparison showing estate homes and wooded residential setting

Note: Information is provided for general purposes only. Review the full disclaimer at the bottom of this page.

Cliff Estates and Wellesley Farms sit at the top of the Wellesley market, but they offer very different living environments. Cliff Estates is defined by architectural presence, wider streets, and a more structured streetscape. Wellesley Farms is shaped by landscape—winding roads, wooded lots, and a setting that feels more private and less exposed to the street.

The Daily Rhythm: Presence vs. Privacy

The difference becomes clear in how each neighborhood lives from day to day.

Cliff Estates: Scale and Curb Appeal

Cliff Estates is defined by visibility and structure. Homes tend to sit prominently on broader, flatter lots, creating a consistent sense of curb appeal across the neighborhood. The layout is more uniform than most parts of town, with a stronger emphasis on presentation from the street.

Architecture is anchored by larger Colonials and newer estate homes. Daily life benefits from proximity to both Wellesley Hills and Wellesley Square, offering convenient access to shops, dining, and commuter rail.

Wellesley Farms: Landscape and Privacy

Wellesley Farms is defined by its natural setting. Roads follow the terrain, and homes are often set deeper on wooded lots, creating more separation from the street and from neighboring properties.

Architecture includes 1920s Tudors, Shingle Style homes, and newer construction integrated into the landscape. The neighborhood feels quieter and less structured, with a more organic layout. For commuters, the Farms station offers one of the shorter scheduled rail trips into Boston.

By the Numbers: Key Differences

For a clearer side-by-side breakdown, here’s how the two neighborhoods compare across the factors that tend to matter most to buyers.

Feature Cliff Estates Wellesley Farms
Character Stately & Private Pastoral & Secluded
Curb Appeal Front-facing, manicured lawns Deep setbacks, wooded lots
Architecture Stately Colonials & New Estates 1920s Tudors & Shingle Style
Lot Size 0.5–1.5+ acres 0.4–1.0+ acres
Commute Access to Hills & Square Short scheduled rail trip to Boston

Notes:

  • Pricing note: Both neighborhoods operate at the high end of the Wellesley market. Cliff Estates typically has a higher concentration of larger new construction homes, while Wellesley Farms includes a mix of historic and newer properties set on more varied lots.
  • Architecture note: Architecture reflects dominant housing character and common home styles, not a complete architectural inventory.
  • Landscape note: Lot size, topography, and landscape patterns vary by property and should be verified independently.

Frequently Asked Questions

Which neighborhood has more curb appeal?

Cliff Estates. Homes are generally more visible from the street, with wider frontages and a layout that emphasizes architectural presentation.

Which neighborhood feels more private?

Wellesley Farms. Homes are often set deeper on wooded lots, and the combination of elevation changes, mature trees, and varied topography creates more separation from the street.

How do the price ranges compare?

Both neighborhoods operate at the high end of the Wellesley market, but they differ in typical price points and housing mix. Cliff Estates often skews toward larger, newer estate-style homes, while Wellesley Farms includes a broader mix of historic and newer homes set within a more varied landscape.

Metric Cliff Estates Wellesley Farms
Active Listings 6 7
Median List Price $4.12M $2.40M
Avg. Days on Market 30 days 20 days

Notes:

  • Data note: Data reflects active listings and is intended for directional context.
  • Source: Realtor.com neighborhood data.
  • As of: April 2026.
  • Disclaimer: Market conditions change frequently and individual property characteristics vary.

The Bottom Line

Choose Cliff Estates if you prefer a more structured neighborhood with prominent homes and consistent streetscapes, generally at higher price points. Choose Wellesley Farms if you prefer a natural setting with varied topography and greater separation from the street, generally at a wider range of price points.

Matt & Ying Coyle
Matt & Ying Coyle, REALTORS®

Curated Listings

By Team Coyle at Compass

$5,960,000

48 Marshall Road

48 Marshall Rd., Wellesley, MA 02482

5 Beds | 5F 2H Baths | 6,377 Sq Ft

How we get you more

Disclaimer: The information, opinions, estimates, and commentary in this article are provided for general informational and educational purposes only and should not be relied upon as legal, tax, accounting, appraisal, investment, mortgage, financing, zoning, permitting, construction, title, insurance, or other professional advice. Real estate information, market conditions, pricing, measurements, square footage, taxes, zoning, school information, and property details may change without notice and may be incomplete, approximate, or derived from third-party sources. You are solely responsible for independently verifying all facts and for consulting the appropriate licensed or qualified professionals before making any decision or taking any action. Team Coyle does not guarantee the accuracy or completeness of the information provided and is not liable for any loss, damage, cost, or consequence arising from reliance on this content. Your use of this content is also subject to our Terms of Use.

Scroll to Top

Let's Plan your next big move

联系我们 Contact Us

Ying Coyle, REALTOR®

Methodology

TownRatings™ is a proprietary model developed by Team Coyle to provide homebuyers and sellers with a relative assessment of a town’s key characteristics, benchmarked against other select Greater Boston towns. Ratings are based on publicly available data and Team Coyle’s on-the-ground expertise and are intended as a general guide only. They are not guarantees, objective rankings, or a substitute for independent research. Users should consult the appropriate licensed or qualified professionals and independently verify all relevant facts before making any real estate or related decision. Ratings are current as of March 31, 2026.

RATING CATEGORIES

  • Quality of Schools: Based on Massachusetts Department of Elementary and Secondary Education (DESE) 2024 data, with emphasis on Grade 10 MCAS English Language Arts and Mathematics proficiency rates and 4-year high school graduation rates. These measures are used as general indicators only and do not capture every aspect of school quality or student experience.
    Scale: Above Average · Average · Below Average
  • Commute to Boston: Assesses commuting ease using travel time, distance, and in-town transit access. For towns with MBTA rail or subway service, commute times are measured to the line’s natural Boston endpoint (e.g., North Station, South Station, or Back Bay). For towns without in-town service, commute times are measured by car to Back Bay as the default reference point.
    Scale: Easy · Moderate · Challenging
  • Shopping & Dining: Reflects the relative density and variety of retail and restaurant options within a town or in adjacent hubs.
    Scale: Excellent · Good · Limited
  • Lifestyle: A general descriptive summary of a town’s overall character (e.g., Upscale, Rural, Historic, Suburban, Urban/Vibrant). This category is descriptive only and is not intended to suggest who should or should not live in any community.
  • Est. Annual Property Tax: Calculated by averaging the 2025 and 2026 median sale prices per MLSPIN and applying the town’s residential property tax rate (per $1,000 of assessed value), based on data as of March 31, 2026. This is an estimate only and is not a prediction of the taxes due on any specific property.

HOW RATINGS ARE DERIVED

Ratings are determined using a blend of publicly reported data (e.g., DESE reports, MBTA schedules, municipal tax rates, business directories), mapping and transportation tools, and qualitative insights from Team Coyle agents active in these markets.

LIMITATIONS & DISCLAIMERS

  • Informational only: TownRatings™ is provided for general informational and educational purposes only and is subject to change without notice.
  • No duty to update: Team Coyle and its agents have no obligation to update, revise, or refresh any rating, commentary, methodology, or supporting information.
  • No warranties: All information is provided “as is” without warranties of any kind. Team Coyle, its agents, and Compass make no representations or warranties as to accuracy, completeness, timeliness, reliability, or current availability.
  • No liability: Team Coyle, its agents, and Compass are not liable for any losses, damages, or costs arising from use of or reliance on TownRatings™ or related commentary.
  • Not advice: TownRatings™ and related commentary should not be relied upon as legal, tax, financial, investment, educational, transportation, appraisal, or other professional advice. Consult the appropriate licensed or qualified professionals before making any decision or taking any action.
  • Verify independently: Commute times vary by route, timing, traffic, weather, and MBTA conditions—check schedules and test commutes. School performance, assignments, offerings, and district information may change—confirm with school districts and the Massachusetts Department of Elementary & Secondary Education. Amenities, tax rates, and market conditions also change over time and should be independently verified.
  • Third-party content: Third-party data, tools, and source material are not controlled or endorsed by Team Coyle, and their accuracy is not guaranteed. Trademarks remain the property of their respective owners.
  • Broker disclosure: Compass is a licensed real estate broker and abides by Equal Housing Opportunity laws.
  • Fair housing: Nothing in TownRatings™ should be used to encourage or discourage housing decisions based on race, color, religion, sex, disability, familial status, national origin, or any other protected characteristic.