Homeowners Gained $28K in Equity over the Past Year

Note: Information is provided for general purposes only. Review the full disclaimer at the bottom of this page.

Real Estate News

Homeowners Gained $28K in Equity over the Past Year

A small plant sprouting from soil on stacked coins symbolizing financial growth.

If you own a home, your net worth has probably gone up a lot over the past year. Home prices have been rising, which means you’re building equity much faster than you might think. Here’s how it works.

Equity is the current value of your home minus what you owe on the loan.

Over the past year, there have still been more people wanting to buy than there are homes available for sale, and that’s pushed prices up. That rise in prices has translated directly into increasing equity for homeowners.

How Much Equity Have You Earned over the Past 12 Months?

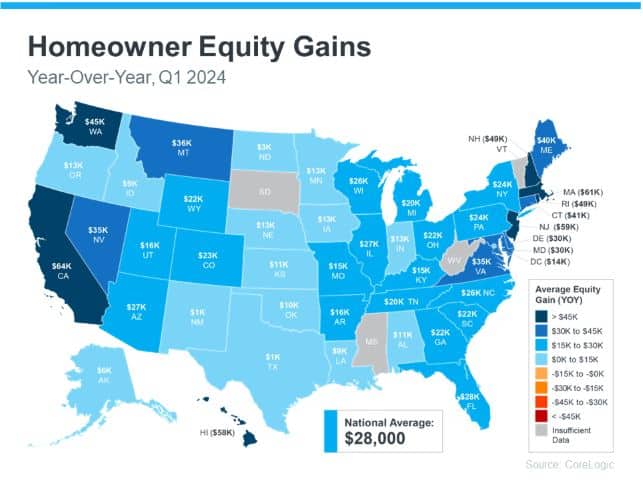
According to the latest Homeowner Equity Insights from CoreLogic, the average homeowner’s equity has grown by $28,000 in the last year alone.

That’s the national average, so if you want to see what’s happening in your state, check out the map below. It uses data from CoreLogic to show how much equity has grown in each state over the past year. You’ll notice every single state with sufficient data saw annual equity gains:

Map showing U.S. homeowner equity gains by state in Q1 2024.

What If You Bought Your House Before the Pandemic?

If you bought your house before the pandemic, the equity news is even better. According to data from Realtor.com, home prices shot up by 37.5% from May 2019 to May 2024, meaning your home’s value has likely increased significantly. Ralph McLaughlin, Senior Economist at Realtor.com, says:

“Homeowners have seen extraordinary gains in home equity over the past five years.”

To give context to how much equity can stack up over time, Selma Hepp, Chief Economist at CoreLogic, explains the total equity the typical homeowner has today:

“With home prices continuing to reach new highs, owners are also seeing their equity approach the historic peaks of 2023, close to a total of $305,000 per owner.”

How Your Rising Home Equity Can Help You

With how prices skyrocketed a few years ago, and the ongoing price growth today, homeowners clearly have substantial equity built up – and that has some serious benefits.


You could use it to start a business, fund an education, or even to help you afford your next home. When you sell, the equity you’ve built up comes back to you, and may be enough to cover a big part – or even all – of your next home’s down payment.

Bottom line

If you’re planning to move, the equity you’ve gained can really help. Curious about how much you have and how you can use it to help pay for your next home? Let’s connect.

Matt & Ying Coyle
Matt & Ying Coyle, REALTORS®

Curated Listings

By Team Coyle at Compass

$5,960,000

48 Marshall Road

48 Marshall Rd., Wellesley, MA 02482

5 Beds | 5F 2H Baths | 6,377 Sq Ft

How we get you more

Disclaimer: The information, opinions, estimates, and commentary in this article are provided for general informational and educational purposes only and should not be relied upon as legal, tax, accounting, appraisal, investment, mortgage, financing, zoning, permitting, construction, title, insurance, or other professional advice. Real estate information, market conditions, pricing, measurements, square footage, taxes, zoning, school information, and property details may change without notice and may be incomplete, approximate, or derived from third-party sources. You are solely responsible for independently verifying all facts and for consulting the appropriate licensed or qualified professionals before making any decision or taking any action. Team Coyle does not guarantee the accuracy or completeness of the information provided and is not liable for any loss, damage, cost, or consequence arising from reliance on this content. Your use of this content is also subject to our Terms of Use.

Scroll to Top

Let's Plan your next big move

联系我们 Contact Us

Ying Coyle, REALTOR®

Methodology

TownRatings™ is a proprietary model developed by Team Coyle to provide homebuyers and sellers with a relative assessment of a town’s key characteristics, benchmarked against other select Greater Boston towns. Ratings are based on publicly available data and Team Coyle’s on-the-ground expertise and are intended as a general guide only. They are not guarantees, objective rankings, or a substitute for independent research. Users should consult the appropriate licensed or qualified professionals and independently verify all relevant facts before making any real estate or related decision. Ratings are current as of March 31, 2026.

RATING CATEGORIES

  • Quality of Schools: Based on Massachusetts Department of Elementary and Secondary Education (DESE) 2024 data, with emphasis on Grade 10 MCAS English Language Arts and Mathematics proficiency rates and 4-year high school graduation rates. These measures are used as general indicators only and do not capture every aspect of school quality or student experience.
    Scale: Above Average · Average · Below Average
  • Commute to Boston: Assesses commuting ease using travel time, distance, and in-town transit access. For towns with MBTA rail or subway service, commute times are measured to the line’s natural Boston endpoint (e.g., North Station, South Station, or Back Bay). For towns without in-town service, commute times are measured by car to Back Bay as the default reference point.
    Scale: Easy · Moderate · Challenging
  • Shopping & Dining: Reflects the relative density and variety of retail and restaurant options within a town or in adjacent hubs.
    Scale: Excellent · Good · Limited
  • Lifestyle: A general descriptive summary of a town’s overall character (e.g., Upscale, Rural, Historic, Suburban, Urban/Vibrant). This category is descriptive only and is not intended to suggest who should or should not live in any community.
  • Est. Annual Property Tax: Calculated by averaging the 2025 and 2026 median sale prices per MLSPIN and applying the town’s residential property tax rate (per $1,000 of assessed value), based on data as of March 31, 2026. This is an estimate only and is not a prediction of the taxes due on any specific property.

HOW RATINGS ARE DERIVED

Ratings are determined using a blend of publicly reported data (e.g., DESE reports, MBTA schedules, municipal tax rates, business directories), mapping and transportation tools, and qualitative insights from Team Coyle agents active in these markets.

LIMITATIONS & DISCLAIMERS

  • Informational only: TownRatings™ is provided for general informational and educational purposes only and is subject to change without notice.
  • No duty to update: Team Coyle and its agents have no obligation to update, revise, or refresh any rating, commentary, methodology, or supporting information.
  • No warranties: All information is provided “as is” without warranties of any kind. Team Coyle, its agents, and Compass make no representations or warranties as to accuracy, completeness, timeliness, reliability, or current availability.
  • No liability: Team Coyle, its agents, and Compass are not liable for any losses, damages, or costs arising from use of or reliance on TownRatings™ or related commentary.
  • Not advice: TownRatings™ and related commentary should not be relied upon as legal, tax, financial, investment, educational, transportation, appraisal, or other professional advice. Consult the appropriate licensed or qualified professionals before making any decision or taking any action.
  • Verify independently: Commute times vary by route, timing, traffic, weather, and MBTA conditions—check schedules and test commutes. School performance, assignments, offerings, and district information may change—confirm with school districts and the Massachusetts Department of Elementary & Secondary Education. Amenities, tax rates, and market conditions also change over time and should be independently verified.
  • Third-party content: Third-party data, tools, and source material are not controlled or endorsed by Team Coyle, and their accuracy is not guaranteed. Trademarks remain the property of their respective owners.
  • Broker disclosure: Compass is a licensed real estate broker and abides by Equal Housing Opportunity laws.
  • Fair housing: Nothing in TownRatings™ should be used to encourage or discourage housing decisions based on race, color, religion, sex, disability, familial status, national origin, or any other protected characteristic.