Real Estate News

How Mortgage Rate Changes Impact Your Homebuying Power

A percentage symbol on a blue-toned pile of US dollar bills.

If you’re thinking about buying or selling a home, you’ve probably got mortgage rates on your mind. That’s because you’ve likely heard that mortgage rates impact how much you can afford in your monthly mortgage payment, and you want to factor that into your planning. Here’s what you need to know.

What’s Happening with Mortgage Rates?

Mortgage rates have been trending down recently. While that’s good news for your homebuying plans, it’s important to know that rates can be unpredictable because they’re affected by many factors.

Things like the economy, job market, inflation, and decisions made by the Federal Reserve all play a part. So, even as rates go down, they can still bounce around a bit based on new economic data. As Odeta Kushi, Deputy Chief Economist at First American, says:

“The ongoing deceleration in inflation, coupled with the Federal Reserve’s recent indication of potential rate cuts [in 2024], suggests an environment supportive of modest declines in mortgage rates. Barring any unforeseen circumstances and resurgence in inflation, lower mortgage rates could be on the horizon, but the journey towards them might be slow and bumpy.

How Do These Changes Affect You?

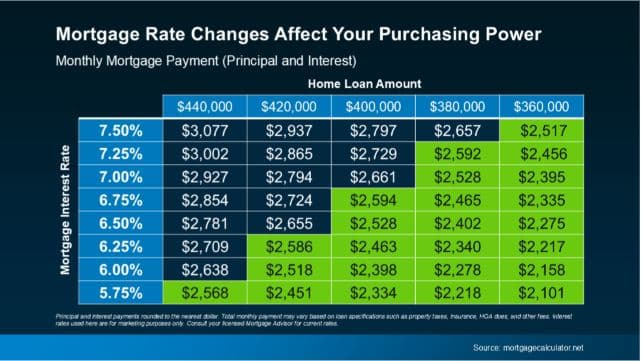
When mortgage rates change, it affects how much you pay each month for your home loan. Even a small rate change can make a big difference to your monthly bill.

Take a look at the chart below to see how different mortgage rates impact your house payment each month for various loan amounts. Imagine you can afford a monthly payment of $2,600 for your home loan. The green part in the chart shows payments in that range or lower based on varying mortgage rates (see chart below):

Table showing monthly payments for different home loan amounts and interest rates.

Understanding how mortgage rates impact your payment helps you make better decisions.

How Can You Keep Track of the Latest on Rates?

Real estate agents have the expertise to help you understand what’s happening and what it means for you. They can provide tools and visuals, like the chart above, to show how rate changes impact your buying power.

You don’t need to be a mortgage expert; you just need a professional by your side. Someone who can help you make sense of the market and guide you through your homebuying or selling journey.

Bottom line

If you have questions about the housing market, let’s connect. That way you’ll understand what’s going on and how to navigate it.

Scroll to Top

Methodology

TownRatings™ is a proprietary model developed by Team Coyle to provide homebuyers and sellers with a relative rating (assessment) of a town’s key characteristics, benchmarked against other Greater Boston towns. Ratings are based on publicly available data and Team Coyle’s on-the-ground expertise and are intended as a general guide only. Please consult a licensed real estate professional before making any real estate decisions. Ratings are current as of October 4, 2025.

RATING CATEGORIES

  • Quality of Schools: Based on Massachusetts Department of Elementary and Secondary Education (DESE) 2024 data, emphasizing Grade 10 MCAS English Language Arts and Mathematics proficiency rates and 4-year high school graduation rates. Together, these measures provide a snapshot of academic achievement and long-term outcomes.
    Scale: Above Average · Average · Below Average
  • Commute to Boston: Assesses commuting ease using travel time, distance, and in-town transit access. For towns with MBTA rail or subway service, commute times are measured to the line’s natural Boston endpoint (e.g., North Station, South Station, or Back Bay). For towns without in-town service, commute times are measured by car to Back Bay as the default reference point.
    Scale: Easy · Moderate · Challenging
  • Shopping & Dining: Reflects the density and variety of retail and restaurant options within a town or in adjacent hubs.
    Scale: Excellent · Good · Limited
  • Lifestyle: A general description a town's overall character (e.g., Upscale, Rural, Historic, Suburban, Urban/Vibrant).
  • Est. Annual Tax per $1M: The town’s residential property tax rate applied to $1,000,000 of value (as of the report date) for easy comparison.

HOW RATINGS ARE DERIVED

Ratings are determined using a blend of publicly reported data (e.g., DESE reports, MBTA schedules, municipal tax rates, business directories), mapping and transportation tools, and qualitative insights from Team Coyle agents active in these markets.

LIMITATIONS & DISCLAIMERS

  • Informational only; subject to change without notice.
  • No duty to update: Team Coyle and its agents are not obligated to refresh or revise ratings.
  • No warranties: Information is provided “as is” without warranties of any kind.
  • No liability: Team Coyle, its agents, and Compass are not liable for any losses, damages, or costs arising from use or reliance.
  • Not advice: not legal, tax, financial, educational, or transportation advice. Consult a licensed real estate professional/agent and other appropriate professionals.
  • Verify independently: Commute times vary (route/time/weather) — check MBTA schedules and test commutes. School offerings and performance change — confirm with districts and the MA Dept. of Elementary & Secondary Education. Amenities evolve — verify locally.
  • Third-party content not endorsed; accuracy not guaranteed. Trademarks belong to their owners.
  • Broker disclosure: Compass is a licensed real estate broker and abides by Equal Housing Opportunity laws.
  • Fair housing: Nothing here should be used to encourage or discourage housing decisions based on protected characteristics.

Get in Touch

Matt Coyle, REALTOR®
Address
161 Linden St, Suite 102
Wellesley, MA 02482