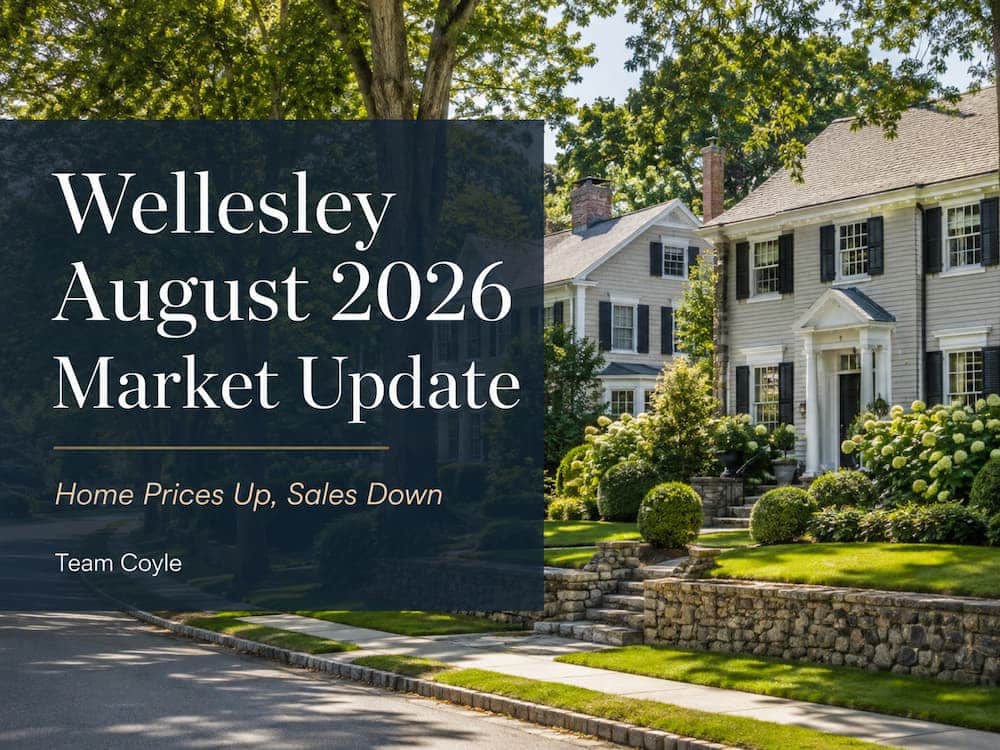
In our Midyear Market Update , we reported that Wellesley home prices were rising even as sales declined and the negotiating position of buyers improved.
Approximately 45 days later, that trend continues.
However, we are now observing a modest buildup of unsold inventory.
Importantly, this isn't being driven by a surge of new listings. Over the past 12 months, the number of Wellesley homes listed increased just 1.4%, while closed sales declined 9.0%. In other words, homes are coming onto the market at roughly the same pace, but fewer are selling.
We believe the buildup is due to seller overreach and growing buyer hesitation. The latter may reflect weakening consumer sentiment and growing uncertainty about inflation, interest rates, employment and the broader economic outlook.
The result is a market where prices remain strong even as sales slow, inventory builds and buyers take longer to act.
| Market Indicators | 2025 | 2026 | Change |
|---|---|---|---|
| Median sale price | $2.15M | $2.325M | ▲ 8.1% |
| Closed sales | 279 | 254 | ▼ 9.0% |
| Active inventory | 37 | 42 | ▲ 13.5% |
| Days to offer | 22 days | 27 days | ▲ 22.7% |
Source: MLS PIN. Wellesley single-family homes. Listing activity, median sale price, closed sales and days to offer compare the 12-month periods ending August 14, 2025 and August 14, 2026. Active inventory compares homes for sale on August 14 of each year.
Video: Wellesley’s Two-Tier Market
Watch Matt Coyle explain what’s driving Wellesley’s two-tier real estate market and what it means for buyers and sellers.
What's Changed Since Our Midyear Report?
The most noticeable shift in the data is the gradual accumulation of active listings on the market.
In Wellesley
| Wellesley Indicators | 2025 | 2026 | Change |
|---|---|---|---|
| Active inventory | 37 | 42 | ▲ 13.5% |
| Months supply | 1.59 | 1.98 | ▲ 24.5% |
| Days to offer | 22 days | 27 days | ▲ 22.7% |
Source: MLS PIN, Wellesley single-family homes. Active inventory and months supply compare August 14 of each year. Days to offer compares the respective 12-month periods ending August 14.
The Trend Extends Beyond Wellesley
This is not an isolated local event. Across the broader Greater Boston real estate market we track, similar patterns are playing out.
| Greater Boston Indicators | 2025 | 2026 | Change |
|---|---|---|---|
| Active inventory | 1,857 | 2,192 | ▲ 18.0% |
| Months supply | 1.61 | 1.93 | ▲ 19.9% |
| New listings YTD | 12,059 | 12,026 | Essentially flat |
| Price-changed listings* | 4,025 | 4,466 | ▲ 11.0% |
Source: MLS PIN, Greater Boston single-family market tracked by Team Coyle, through August 14, 2026. *Price-changed listings compare trailing 12-month activity; new listings are year-to-date.
Wellesley: A Two-Tier Market
To better understand what’s happening beneath the headline numbers, we analyzed every Wellesley single-family home sold year-to-date through August 14 — 166 sales in total.
The results reveal a remarkably divided market, particularly in how quickly homes sold and where they ultimately closed relative to the seller’s original asking price.
| Homes Sold (YTD 2026) | # | Share | Median DOM | Net Price Change |
|---|---|---|---|---|
| Above Original Ask | 76 | 45.8% | 6.5 days | +6.3% |
| At Original Ask | 9 | 5.4% | 11 days | 0.0% |
| Below Original Ask | 81 | 48.8% | 38 days | -6.4% |
Source: Team Coyle analysis of MLS PIN, Wellesley single-family closed sales from January 1 through August 14, 2026. 166 total sales.
Net price change represents the average percentage difference between the final sale price and the original asking price within each category. DOM = Days on Market.
The contrast is striking. Homes that sold above their original asking price had a median DOM of just 6.5 days at a price averaging 6.3% above asking.
By comparison, homes that sold below their original asking price had a median DOM of 38 days at a price averaging 6.4% below asking.
That equals a nearly sixfold difference in days on market and a 12.7 percentage-point difference in the final price relative to the seller’s original asking price. That’s a meaningful difference—and the two-tier market in practical terms.
That’s good news for sellers because it means there are still plenty of buyers willing to act quickly and pay your price when they see value.
Because when a home is priced too aggressively, buyers are much more willing to wait—or simply move on.
Conversely, homes priced right are selling quickly and at a good price.
And that’s a big part of why we’re seeing inventory begin to build.
Explore Luxury Sales by Team Coyle →
What This Means for Buyers
For buyers, the gradual buildup in inventory is creating more choice and, in some situations, more negotiating room.
But that doesn't mean every home is negotiable.
The best-priced homes are still moving quickly—and many are still selling at or above their original asking price.
So if you find a home you like and the price makes sense, make a reasonable offer. Waiting for a bargain on a well-priced home may simply mean losing it to another buyer.
The opportunity is in knowing which homes are priced right—and which ones aren't.
Get yourself an agent who knows the market and put yourself in a position to buy the right home.
The Bottom Line
The Wellesley real estate market remains a highly sought-after, attractive market for homebuyers. Median sale prices are still 8.1% higher than a year ago, even as fewer homes are selling.
What has truly changed is the pace and selectivity of the market:
- Unsold inventory is beginning to build.
- Buyers are taking longer to act.
- Well-priced homes are still moving quickly.
- Homes priced above the market are facing greater resistance.
For sellers, that makes competitive pricing from day one more critical than ever .
Indeed, the market is more balanced than it was a few years ago.