Inflation won't destroy the value of your home
Inflation Reduces the Purchasing Power of Your Money

Inflation Won't Destroy the Value of Your Home

Inflation, however, will increase your property taxes and the cost of other goods and services

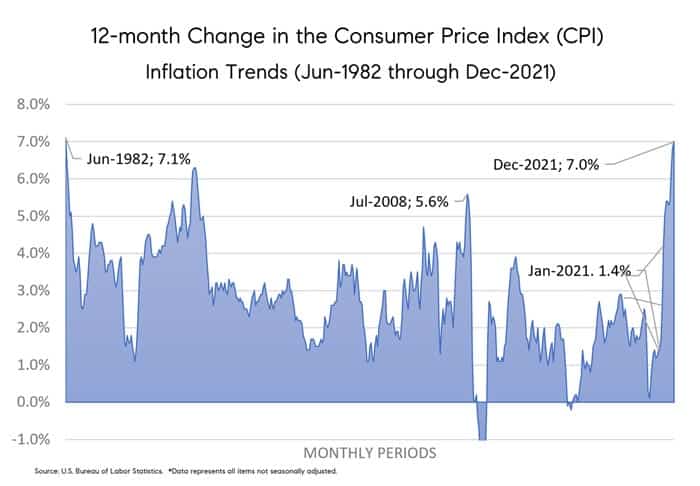
In Dec-2021, inflation, as measured by the consumer price index (CPI), raged ahead at its fastest 12-month pace in nearly 40 years.  According to the Bureau of Labor Statistics, the 12-month change in CPI reached 7% in December, a level not seen since June 1982. To put it into context, that’s roughly 3.7 times higher than the 10-year average of 1.9% and 3.2 times higher than the 20-year average of 2.2%.

Graph showing 12-month CPI inflation trends from 1982 to 2021.

As a result, homeowners and investors are now asking the question of how inflation will impact their real estate holdings. For homeowners or investors that currently own real estate, the news is good. Real estate, in general, has traditionally outperformed other asset classes (e.g., stocks, bonds, etc.) during inflationary periods for three basic reasons.

3 Reason Why Real Estate Outperforms Other Asset Classes in an Inflationary Environment
 

First, property owners, in general, benefit from the ability to charge higher annual rents (income) as most leases are indexed for inflation or a 12-month change in the consumer price index (CPI).

Secondly, inflation increases construction costs (labor and raw materials) which raises the price (value) of new and existing homes. The latter benefits from the step-up effect associated with higher replacement costs and the previously mentioned ability to charge higher rents.

Thirdly, inflation effectively devalues long-term, fixed-rate debt or mortgage loans as it allows borrowers to pay down their fixed-rate debt with inflated (cheaper) dollars.

That’s the good news. The bad news is that inflation typically raises interest rates or borrowing costs which reduces demand for real estate and partially offsets any increase in home prices. Moreover, inflation raises property taxes which partially mitigates the returns received by homeowners and investors.

Bottom line, if you’re a homeowner or an investor who owns property, real estate, in general, has proven to be an effective hedge.

Picture of Team Coyle

Team Coyle

Team Coyle (Matt & Ying) is a top-ranked real estate team at Compass with more than ten years of experience helping individuals and families buy and sell real estate in Massachusetts (primarily in the Metro West region).

Scroll to Top

Methodology

TownRatings™ is a proprietary model developed by Team Coyle to provide homebuyers and sellers with a relative rating (assessment) of a town’s key characteristics, benchmarked against other Greater Boston towns. Ratings are based on publicly available data and Team Coyle’s on-the-ground expertise and are intended as a general guide only. Please consult a licensed real estate professional before making any real estate decisions. Ratings are current as of October 4, 2025.

RATING CATEGORIES

  • Quality of Schools: Based on Massachusetts Department of Elementary and Secondary Education (DESE) 2024 data, emphasizing Grade 10 MCAS English Language Arts and Mathematics proficiency rates and 4-year high school graduation rates. Together, these measures provide a snapshot of academic achievement and long-term outcomes.
    Scale: Above Average · Average · Below Average
  • Commute to Boston: Assesses commuting ease using travel time, distance, and in-town transit access. For towns with MBTA rail or subway service, commute times are measured to the line’s natural Boston endpoint (e.g., North Station, South Station, or Back Bay). For towns without in-town service, commute times are measured by car to Back Bay as the default reference point.
    Scale: Easy · Moderate · Challenging
  • Shopping & Dining: Reflects the density and variety of retail and restaurant options within a town or in adjacent hubs.
    Scale: Excellent · Good · Limited
  • Lifestyle: A general description a town's overall character (e.g., Upscale, Rural, Historic, Suburban, Urban/Vibrant).
  • Est. Annual Tax per $1M: The town’s residential property tax rate applied to $1,000,000 of value (as of the report date) for easy comparison.

HOW RATINGS ARE DERIVED

Ratings are determined using a blend of publicly reported data (e.g., DESE reports, MBTA schedules, municipal tax rates, business directories), mapping and transportation tools, and qualitative insights from Team Coyle agents active in these markets.

LIMITATIONS & DISCLAIMERS

  • Informational only; subject to change without notice.
  • No duty to update: Team Coyle and its agents are not obligated to refresh or revise ratings.
  • No warranties: Information is provided “as is” without warranties of any kind.
  • No liability: Team Coyle, its agents, and Compass are not liable for any losses, damages, or costs arising from use or reliance.
  • Not advice: not legal, tax, financial, educational, or transportation advice. Consult a licensed real estate professional/agent and other appropriate professionals.
  • Verify independently: Commute times vary (route/time/weather) — check MBTA schedules and test commutes. School offerings and performance change — confirm with districts and the MA Dept. of Elementary & Secondary Education. Amenities evolve — verify locally.
  • Third-party content not endorsed; accuracy not guaranteed. Trademarks belong to their owners.
  • Broker disclosure: Compass is a licensed real estate broker and abides by Equal Housing Opportunity laws.
  • Fair housing: Nothing here should be used to encourage or discourage housing decisions based on protected characteristics.

Get in Touch

Matt Coyle, REALTOR®
Address
161 Linden St, Suite 102
Wellesley, MA 02482