Real Estate News

Is Inventory Getting Back To Normal?

woman, presentation, marketing, statistical, company, graphic, digital, information

After years of it feeling almost impossible to find a home you want to buy, things are changing for the better.

Nationally, inventory is growing, and that gives you more options for your move. But here’s what you need to know. That level of growth is going to vary based on where you live. And that’s why you need an agent’s local market expertise.

Here’s a quick rundown of the current inventory situation, so you know what’s happening and what to expect.

Significant Growth Across the Nation

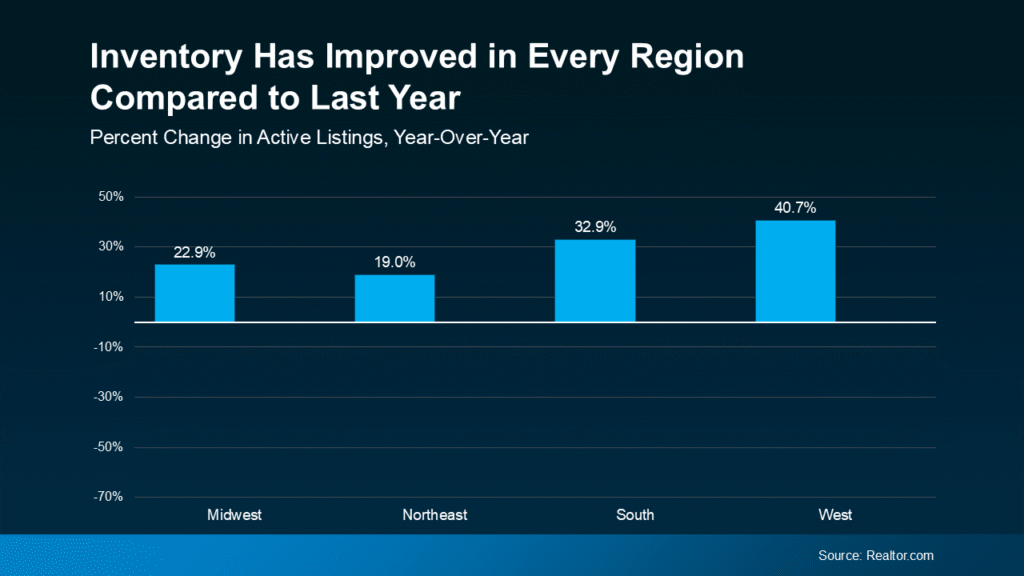
Nationally, the number of homes for sale is rising – and that’s true in all regions of the country. That’s shown in this data from Realtor.com. In each of the four regions, inventory is up at least 19% compared to the same time last year. In the West, it’s actually up almost 41% year-over-year (see graph below):

Team Coyle Real Estate Agents | Massachusetts, Wellesley, Weston, Natick, Sherborn, Acton, Dover

There are two main reasons for this increase:

  • More sellers are listing their homes. Many homeowners have been waiting for mortgage rates to drop before making a move. Now, some have decided they can’t wait any longer. May had more new listings than any May in the past three years.
  • Homes are taking longer to sell. That means listings are staying on the market longer, which increases the total number of homes available. In May, the typical home took 51 days to sell – much closer to what’s more typical for the market.

More homes for sale helps the market become more balanced. For the past few years, sellers have had the upper hand. Now, things are shifting. Nationally, it’s not a full-on buyer’s market yet, but it’s heading toward a healthier place, especially for homebuyers. Danielle Hale, Chief Economist at Realtor.comexplains:

“The number of homes for sale is rising in many markets, giving shoppers more choices than they’ve had in years . . . the market is starting to rebalance.

How Much Growth We’ve Seen Varies by Area

But, how long it’s going to take to achieve true balance is going to vary by area. Some parts of the country are seeing inventory bounce all the way back to normal levels, while others haven’t grown quite that much yet.

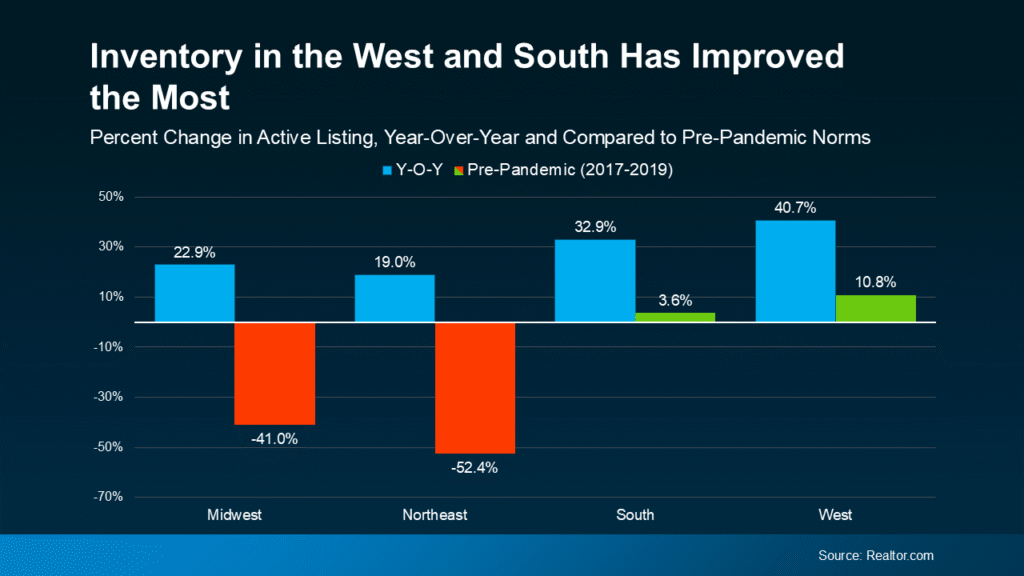
Let’s take a look at another graph. This time, we’ll compare the current data (what you already saw) to the last normal years in the housing market (2017-2019).

In this comparison, the green shows which regions are back at more typical levels for inventory based on the growth we’ve seen lately. The red shows where things have improved, but are still well below the norm (see graph below):

Team Coyle Real Estate Agents | Massachusetts, Wellesley, Weston, Natick, Sherborn, Acton, Dover

Here’s what that means for you. Across the board, you have more options now than you would’ve just one year ago. And that’s a really good thing. More choices means it should be a bit easier to find a home you love.

But not all markets are the same – some will take a bit longer to get back to more typical levels. So, lean on a local agent to find out what the inventory situation looks like where you want to live. They’ll be able to tell you how much growth they’ve seen locally and how to tailor your home search based on what’s available in that area. This is just one of the reasons a local agent’s perspective matters. 

Bottom line

Inventory is getting better, but how long it takes to get back to normal is going to be different based on where you’re looking to buy. Let’s talk about what’s happening in our local market and how it affects your next move.

Matt & Ying Coyle, Team Coyle — Compass agents in Wellesley

Get your free home valuation now

Serving Wellesley and other Greater Boston towns
Scroll to Top

Get in Touch

Matt Coyle, REALTOR®
Address
161 Linden St, Suite 102
Wellesley, MA 02482

Methodology

TownRatings™ is a proprietary model developed by Team Coyle to provide homebuyers and sellers with a relative rating (assessment) of a town’s key characteristics, benchmarked against other Greater Boston towns. Ratings are based on publicly available data and Team Coyle’s on-the-ground expertise and are intended as a general guide only. Please consult a licensed real estate professional before making any real estate decisions. Ratings are current as of October 4, 2025.

RATING CATEGORIES

  • Quality of Schools: Based on Massachusetts Department of Elementary and Secondary Education (DESE) 2024 data, emphasizing Grade 10 MCAS English Language Arts and Mathematics proficiency rates and 4-year high school graduation rates. Together, these measures provide a snapshot of academic achievement and long-term outcomes.
    Scale: Above Average · Average · Below Average
  • Commute to Boston: Assesses commuting ease using travel time, distance, and in-town transit access. For towns with MBTA rail or subway service, commute times are measured to the line’s natural Boston endpoint (e.g., North Station, South Station, or Back Bay). For towns without in-town service, commute times are measured by car to Back Bay as the default reference point.
    Scale: Easy · Moderate · Challenging
  • Shopping & Dining: Reflects the density and variety of retail and restaurant options within a town or in adjacent hubs.
    Scale: Excellent · Good · Limited
  • Lifestyle: A general description a town's overall character (e.g., Upscale, Rural, Historic, Suburban, Urban/Vibrant).
  • Est. Annual Tax per $1M: The town’s residential property tax rate applied to $1,000,000 of value (as of the report date) for easy comparison.

HOW RATINGS ARE DERIVED

Ratings are determined using a blend of publicly reported data (e.g., DESE reports, MBTA schedules, municipal tax rates, business directories), mapping and transportation tools, and qualitative insights from Team Coyle agents active in these markets.

LIMITATIONS & DISCLAIMERS

  • Informational only; subject to change without notice.
  • No duty to update: Team Coyle and its agents are not obligated to refresh or revise ratings.
  • No warranties: Information is provided “as is” without warranties of any kind.
  • No liability: Team Coyle, its agents, and Compass are not liable for any losses, damages, or costs arising from use or reliance.
  • Not advice: not legal, tax, financial, educational, or transportation advice. Consult a licensed real estate professional/agent and other appropriate professionals.
  • Verify independently: Commute times vary (route/time/weather) — check MBTA schedules and test commutes. School offerings and performance change — confirm with districts and the MA Dept. of Elementary & Secondary Education. Amenities evolve — verify locally.
  • Third-party content not endorsed; accuracy not guaranteed. Trademarks belong to their owners.
  • Broker disclosure: Compass is a licensed real estate broker and abides by Equal Housing Opportunity laws.
  • Fair housing: Nothing here should be used to encourage or discourage housing decisions based on protected characteristics.