The Truth About Newly Built Homes and Today’s Market

Note: Information is provided for general purposes only. Review the full disclaimer at the bottom of this page.

Real Estate News

The Truth About Newly Built Homes and Today’s Market

Wooden house frames on architectural blueprints.

Headlines are talking about the inventory of new homes and how we’re back at the levels not seen since 2009. And maybe you’re reading that and thinking: oh no, here we go again. That’s because you remember the housing crash of the late 2000s and you’re worried we’re repeating the same mistakes.

But before you let fear take hold, remember: headlines are designed to be clickbait. And a lot of the time, they do more to terrify than clarify. That’s because they don’t always give you all the context you need. So, let’s take a step back and look at what the data really says.

Why This Isn’t Like 2008

While it’s true the number of new homes on the market has reached its highest level since 2009, that’s not a cause for alarm.

Here’s the context that matters most. When the data is turned into a graph, it’s clear the amount seen in 2009 wasn’t the peak of oversupply – not even close. That high point came earlier in 2007-2008. If anything, 2009 was when the number of new homes being built was really starting to slide back down (see graph below):

Graph showing new home listings hitting highest level since 2009 in February 2023.

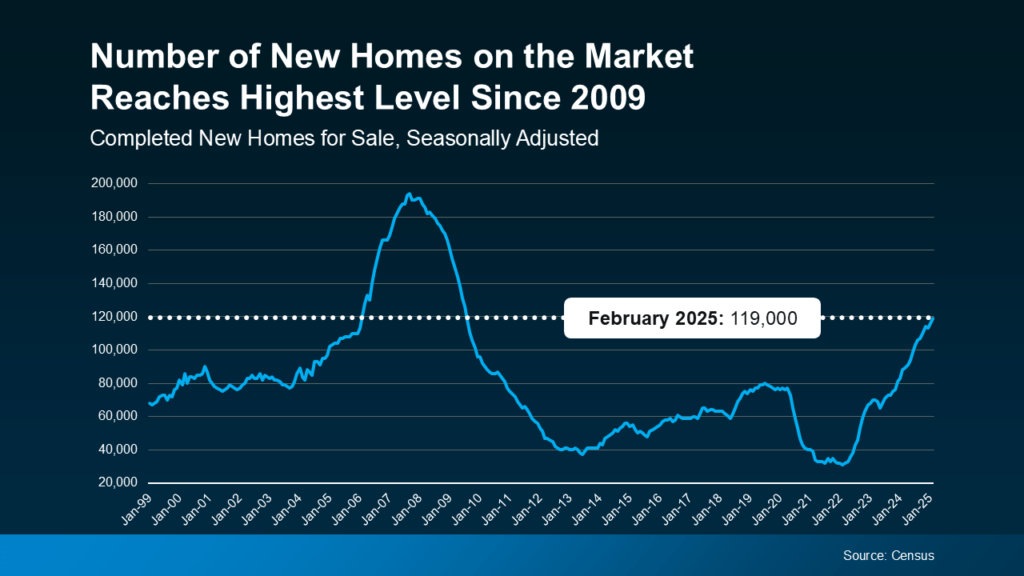
The overbuilding that contributed to the housing crash happened in the years leading up to 2008. Not in 2009. At that point, construction was already slowing down. So, saying we’ve hit 2009 levels isn’t the same thing as saying we’re overbuilding like we did the last time.

Builders Have Actually Underbuilt for Over a Decade

Here’s some more data to prove it to you. After the crash, builders pulled production way back. As a result, they built far fewer homes than the market needed. And that was a consistent problem that lasted for over a decade. That long stretch of underbuilding created a major housing shortage, which is still a challenge today.

The graph below uses Census data to show the number of new homes built each year over the past 52 years. You can clearly see the overbuilding leading up to the crash (in red), the period of underbuilding that followed (in orange), and how we’re only now getting back to a more normal level of construction:

Bar graph showing rising housing completions and overbuilding risks since 1970.

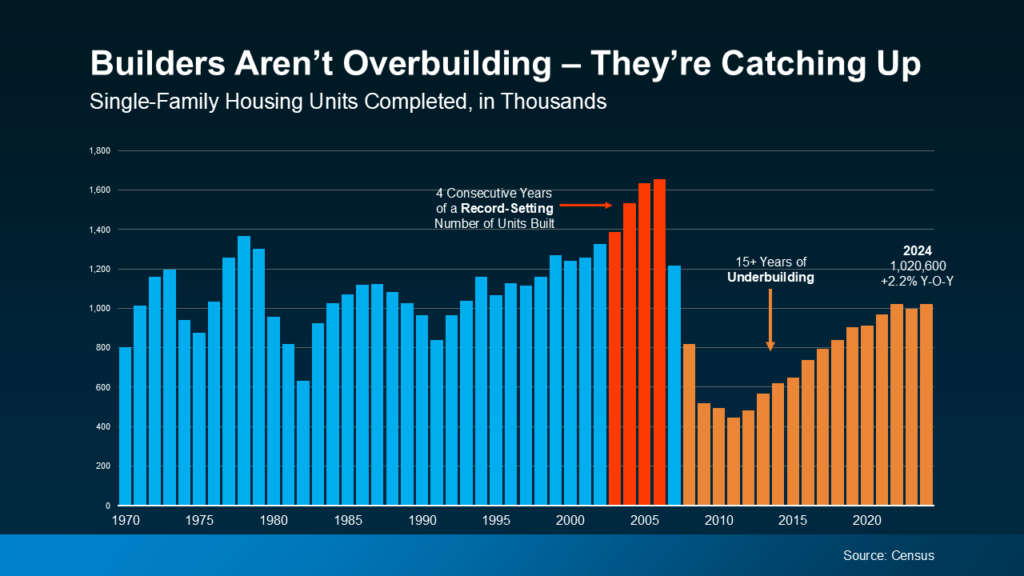
Today’s situation is different. Builders aren’t overbuilding – they’re catching up.

In a recent article, Odeta Kushi, Deputy Chief Economist at First American, highlights this deficit and speaks to why the recent ramp-up in construction is actually good for today’s market, especially buyers:

This means more homes on the market and more options for home buyers, which is good news for a housing market that has been underbuilt for over a decade.”

Of course, like anything else in real estate, the level of supply and demand will vary by market. Some markets may have more newly built homes, some less. But, nationally, there’s nothing to worry about. This isn’t like the last time.

Bottom line

No matter what you’re reading or seeing, the growing number of newly built homes on the market isn’t a red flag nationally – it’s a sign builders are starting to make up for years of underbuilding. If you want to talk about what’s happening in our market, let’s connect.

Matt & Ying Coyle
Matt & Ying Coyle, REALTORS®

Curated Listings

By Team Coyle at Compass

$5,960,000

48 Marshall Road

48 Marshall Rd., Wellesley, MA 02482

5 Beds | 5F 2H Baths | 6,377 Sq Ft

How we get you more

Disclaimer: The information, opinions, estimates, and commentary in this article are provided for general informational and educational purposes only and should not be relied upon as legal, tax, accounting, appraisal, investment, mortgage, financing, zoning, permitting, construction, title, insurance, or other professional advice. Real estate information, market conditions, pricing, measurements, square footage, taxes, zoning, school information, and property details may change without notice and may be incomplete, approximate, or derived from third-party sources. You are solely responsible for independently verifying all facts and for consulting the appropriate licensed or qualified professionals before making any decision or taking any action. Team Coyle does not guarantee the accuracy or completeness of the information provided and is not liable for any loss, damage, cost, or consequence arising from reliance on this content. Your use of this content is also subject to our Terms of Use.

Scroll to Top

Let's Plan your next big move

联系我们 Contact Us

Ying Coyle, REALTOR®

Methodology

TownRatings™ is a proprietary model developed by Team Coyle to provide homebuyers and sellers with a relative assessment of a town’s key characteristics, benchmarked against other select Greater Boston towns. Ratings are based on publicly available data and Team Coyle’s on-the-ground expertise and are intended as a general guide only. They are not guarantees, objective rankings, or a substitute for independent research. Users should consult the appropriate licensed or qualified professionals and independently verify all relevant facts before making any real estate or related decision. Ratings are current as of March 31, 2026.

RATING CATEGORIES

  • Quality of Schools: Based on Massachusetts Department of Elementary and Secondary Education (DESE) 2024 data, with emphasis on Grade 10 MCAS English Language Arts and Mathematics proficiency rates and 4-year high school graduation rates. These measures are used as general indicators only and do not capture every aspect of school quality or student experience.
    Scale: Above Average · Average · Below Average
  • Commute to Boston: Assesses commuting ease using travel time, distance, and in-town transit access. For towns with MBTA rail or subway service, commute times are measured to the line’s natural Boston endpoint (e.g., North Station, South Station, or Back Bay). For towns without in-town service, commute times are measured by car to Back Bay as the default reference point.
    Scale: Easy · Moderate · Challenging
  • Shopping & Dining: Reflects the relative density and variety of retail and restaurant options within a town or in adjacent hubs.
    Scale: Excellent · Good · Limited
  • Lifestyle: A general descriptive summary of a town’s overall character (e.g., Upscale, Rural, Historic, Suburban, Urban/Vibrant). This category is descriptive only and is not intended to suggest who should or should not live in any community.
  • Est. Annual Property Tax: Calculated by averaging the 2025 and 2026 median sale prices per MLSPIN and applying the town’s residential property tax rate (per $1,000 of assessed value), based on data as of March 31, 2026. This is an estimate only and is not a prediction of the taxes due on any specific property.

HOW RATINGS ARE DERIVED

Ratings are determined using a blend of publicly reported data (e.g., DESE reports, MBTA schedules, municipal tax rates, business directories), mapping and transportation tools, and qualitative insights from Team Coyle agents active in these markets.

LIMITATIONS & DISCLAIMERS

  • Informational only: TownRatings™ is provided for general informational and educational purposes only and is subject to change without notice.
  • No duty to update: Team Coyle and its agents have no obligation to update, revise, or refresh any rating, commentary, methodology, or supporting information.
  • No warranties: All information is provided “as is” without warranties of any kind. Team Coyle, its agents, and Compass make no representations or warranties as to accuracy, completeness, timeliness, reliability, or current availability.
  • No liability: Team Coyle, its agents, and Compass are not liable for any losses, damages, or costs arising from use of or reliance on TownRatings™ or related commentary.
  • Not advice: TownRatings™ and related commentary should not be relied upon as legal, tax, financial, investment, educational, transportation, appraisal, or other professional advice. Consult the appropriate licensed or qualified professionals before making any decision or taking any action.
  • Verify independently: Commute times vary by route, timing, traffic, weather, and MBTA conditions—check schedules and test commutes. School performance, assignments, offerings, and district information may change—confirm with school districts and the Massachusetts Department of Elementary & Secondary Education. Amenities, tax rates, and market conditions also change over time and should be independently verified.
  • Third-party content: Third-party data, tools, and source material are not controlled or endorsed by Team Coyle, and their accuracy is not guaranteed. Trademarks remain the property of their respective owners.
  • Broker disclosure: Compass is a licensed real estate broker and abides by Equal Housing Opportunity laws.
  • Fair housing: Nothing in TownRatings™ should be used to encourage or discourage housing decisions based on race, color, religion, sex, disability, familial status, national origin, or any other protected characteristic.