A Tale of Two Housing Markets

For a long time, the housing market was all sunshine for sellers. Homes were flying off the shelves, and buyers had to compete like crazy. But lately, things are starting to shift. Some areas are still super competitive for buyers, while others are seeing more homes sit on the market, giving buyers a bit more breathing room.
In other words, it’s a tale of two markets, and knowing which one you’re in makes a huge difference when you move.
What Is a Buyer’s Market vs. a Seller’s Market?
In a buyer’s market, there are a lot of homes for sale, and not as many people buying. With fewer buyers competing for these homes, that means they generally sit on the market longer, they might not sell for as much as they would in a seller’s market, and buyers have more room to negotiate.
On the flip side, in a seller’s market, there aren’t enough homes for sale for the number of buyers who are trying to purchase them. Homes sell faster, sellers often get multiple offers, and prices shoot higher because buyers are willing to pay more to win the home.
The Market Is Starting To Balance Out
For years, almost every market in the country was a strong seller’s market. That made it tough for buyers – especially first-timers. But now, things are shifting. According to Zillow, the national housing market is balancing out (see graph below):
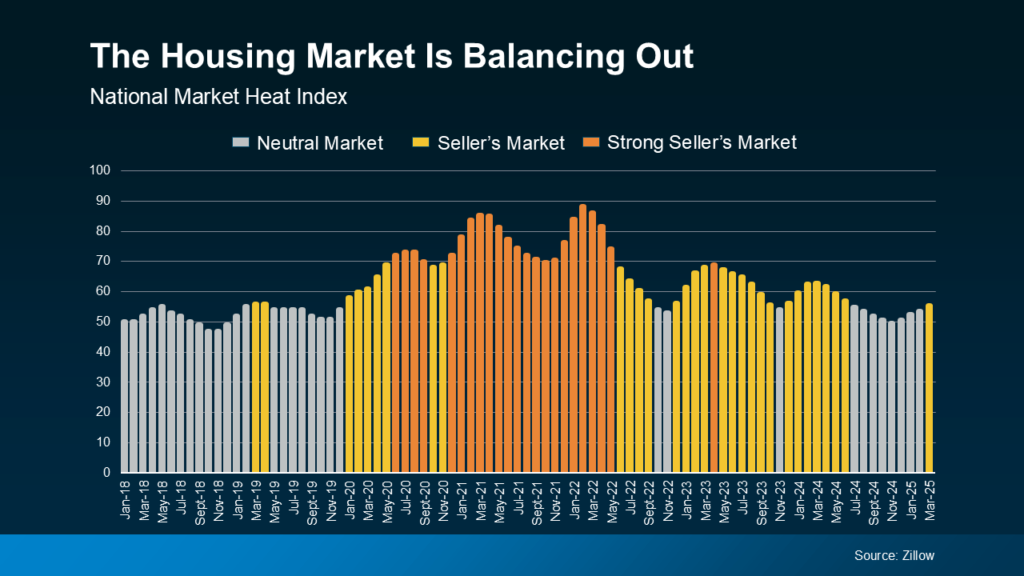
The index used in this graph measures whether the national housing market is more of a seller’s market, buyer’s market, or neutral market – basically, whether it favors buyers, sellers, or if it’s not really swinging either way. Each month, the market is measured between 0 and 100. The closer to 100, the bigger the advantage sellers have.
The orange bars in the middle of the graph show the years when sellers had their strongest advantage, from 2020 to early 2022. But, as time has gone on, the market has become more balanced. It shifted from a strong seller’s market to a less intense one. And lately, it’s been neutral more than anything else (that’s the gray bars on the right side of the graph). That means buyers are gaining some negotiating power again.
In a more balanced or neutral market, homes tend to stay on the market a little longer, bidding wars are less common, and sellers may need to make more concessions – like price reductions or helping with closing costs. That shift gives today’s buyers more opportunities and less competition than a couple of years ago.
Why Are Things Changing?
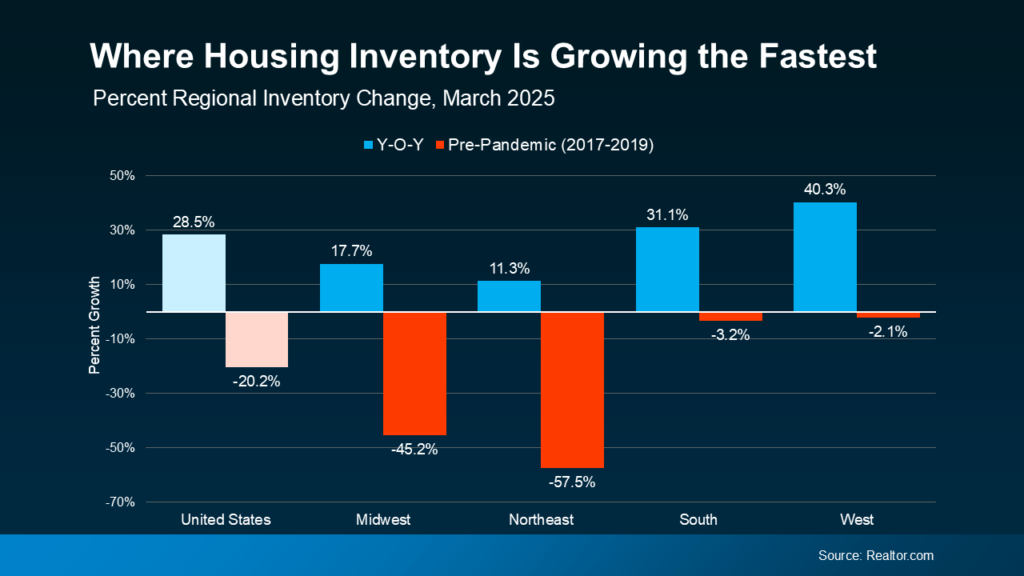
Inventory plays a big role. When there are more homes for sale, buyers have more options – and that cools down home price growth. As data from Realtor.com shows, the supply of available homes for sale isn’t growing at the same rate everywhere (see graph below):
On average, over 11,000 homes sell every day, and yours could be one of them. In the time it took you to read this, another 8 homes sold. When you’re ready to take the next step, let’s connect so you have an agent to create that perfect strategy.
Why Are Things Changing?
Every local market is different. Even if the national headlines say one thing, your town (or even your neighborhood) could be telling a totally different story.
Knowing which type of market you’re in helps you make smarter decisions for your move. That’s why working with a local real estate agent is so important right now.
As Zillow says:
“Agents are experts on their local markets and can craft buying or selling strategies tailored to local market conditions.”
Agents understand the unique trends in your area and can help you make the best choices, whether you’re buying or selling. With their expert strategies, you can move no matter which way the market is leaning, because they know how to navigate various levels of buyer competition, how to find hidden gems locally, how to price a house right, how to negotiate based on who has more leverage, and more
Bottom line
If you’re ready to make a move, or even just thinking about it, let’s connect. That way, you’ll have someone to help you understand our local market and create a game plan that works for you.